Key Highlights & Benefits
The enhanced reporting experience moves beyond simple metrics to provide actionable intelligence:
Forensic Detail: Use the Phishing Audit Log for "specialist mode" investigations, showing the exact sequence of events—from the email arriving to the final user action.
Emotional Intelligence: Track Emotional Susceptibility Profiles (ESP) to understand which lures (curiosity, fear, greed, etc.) are most effective against your team.
Full Automation: Schedule professional reports to reach stakeholders automatically, eliminating manual data pulls.
Actionable KPIs: Identify high-risk teams and individuals at a glance to prioritize your training efforts.
Dashboard Comparison: Legacy vs. Enhanced
The new platform offers deeper insights and improved data delivery:
| Feature | Legacy Reporting | Enhanced Reporting (New) |
|---|---|---|
| Trend Analysis | Limited snapshots. | Rolling 12-month trends with month-over-month comparisons. |
| Behavioral Metrics | Basic click rates. | Measures "Time to Lure" and "Time to Report" to track user maturity. |
| Automation | Manual exports only. |
Fully automated scheduled exports with conditional alerts. |
| Audit Detail | Simple event logs. |
Chronological journey including device info, IP, and repeat interactions. |
Quick: How to Schedule & Export Reports
Automating your reporting ensures leadership stays informed without extra work on your part.
Scheduling an Automated Report
Access the Quick Menu: Click the hamburger icon (three horizontal lines) at the bottom left of the dashboard.
Create Schedule: Select Schedule export, then click Create new schedule.
Configure Delivery: Enter recipient emails, a subject line, and your message body.
Select Data: Choose the specific data tab and sets you want to include.
Set Frequency: Pick your file format, delivery frequency (e.g., daily), and time zone.
Add Value Filters: Use Customize control values to filter the report by specific criteria, such as a particular manager or department.
Finalize: Click Create. You can manage, edit, or pause these at any time via the three-dot menu on the schedules page.
Manual One-Time Export
Select Export from the quick menu at the bottom left.
Choose your format (Excel is recommended to prevent data from being cut off in PDFs).
Click Export to download the file immediately.
Quick: How-To Video
For more detailed instructions, please see our: How to Schedule & Export Phishing Reports guide.
Platform Data Sets Overview
Understanding your data sets helps you craft targeted training:
Lured: Focuses on distinct user counts, lured rates, and the average time it took for a user to fall for a lure.
Reported: Dedicated metrics for users who correctly identified and reported the attack.
Interactions with Attacks: Summarizes clicks on phishing links and instances where sensitive information was submitted.
Emotion Susceptibility Profile: Identifies which departments or users are most vulnerable to specific emotional triggers.
Phishing Audit Log: A granular, simulation-level view containing timestamps, IP addresses, and device types—replacing the need for the legacy Results CSV.
Repeat Clickers: Highlights your highest-risk users who interacted with the same attack multiple times.
Pro-Tips for Admin Success
Data Freshness: The dashboard refreshes approximately every 60 minutes.
Incentivize Reporting: Use the "Top Reporters" view to provide positive reinforcement for vigilant security behavior.
Diversify Emotions: Test across a full range of emotions to build a complete risk profile of your organization.
Prioritize Severity: Treat "Submitted Sensitive Information" as your highest-priority outcome for immediate remediation.
Note: History from deleted simulations is hidden by default but can be toggled on if a historical audit is required.
Important Facts
| Fact | Description |
| Scheduled Emails | Sent from generic domain: info@send.sigmacomputing.com. |
| Custom Branding | Client logo customization is not supported. |
| Custom Sending Domain | Client sending domain customization is not supported. |
| Bulk Management | No mass update/delete for scheduled reports. |
| Null Values | If "Time to Report" is blank, it usually indicates no reports were captured for that specific period |
Detailed Breakdown of Report Tabs
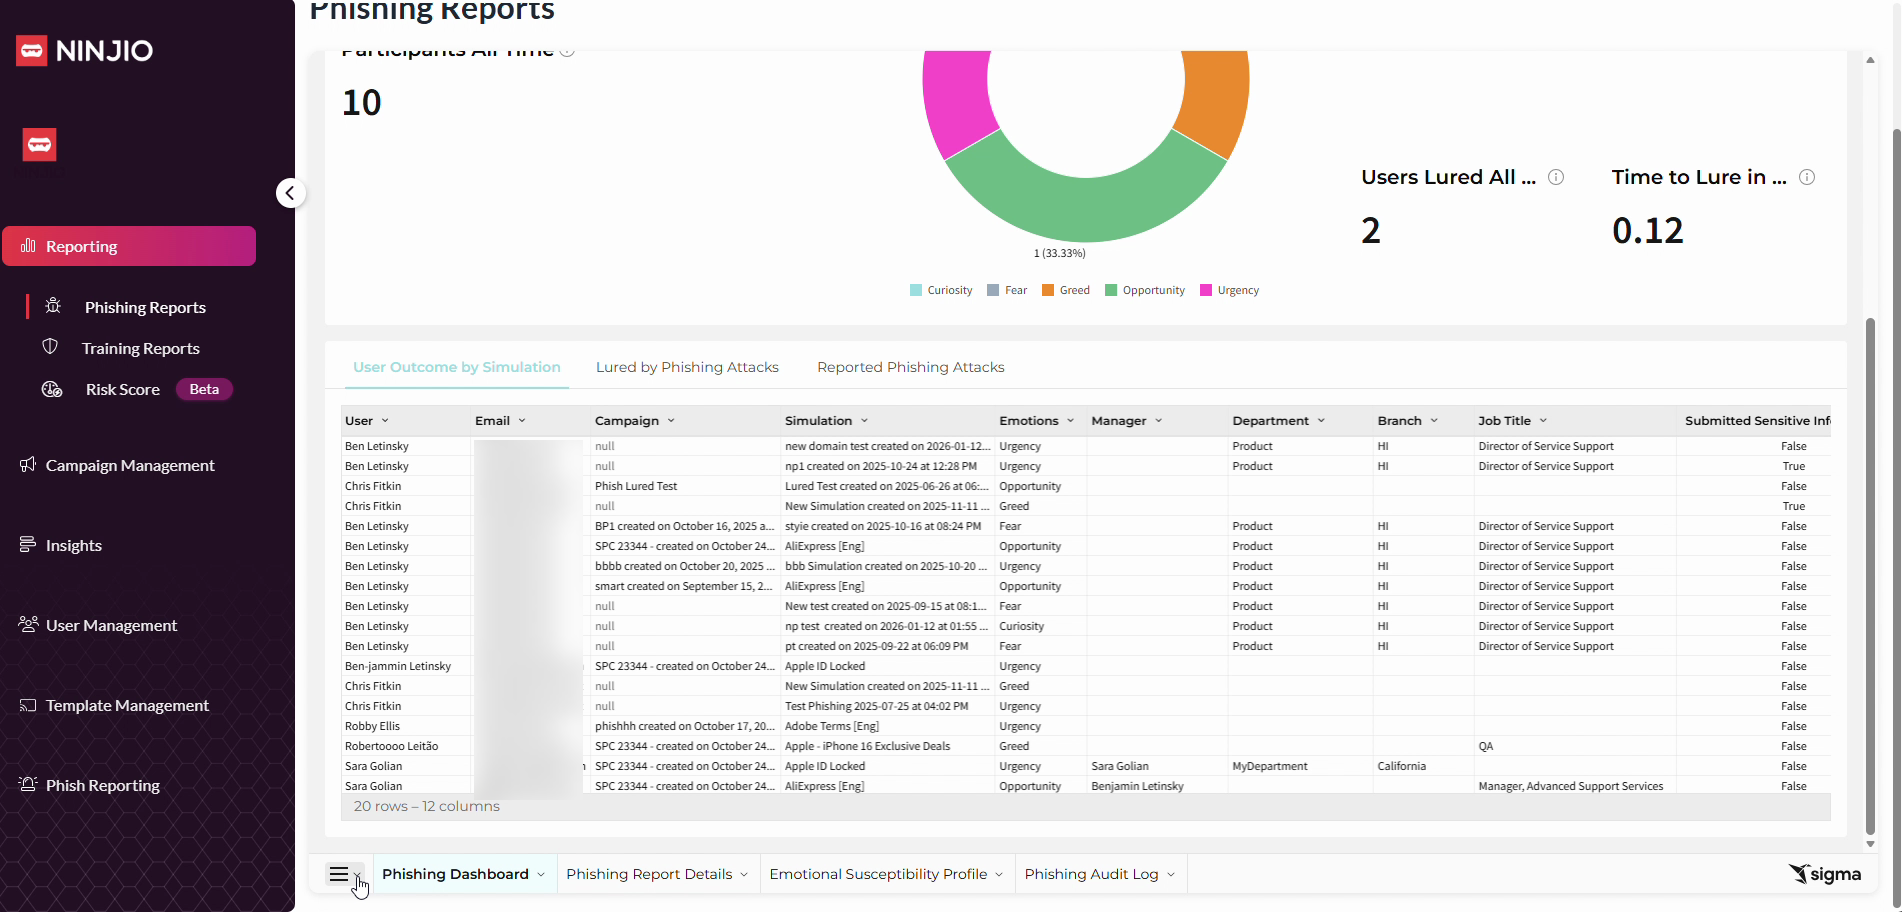
1. Phishing Dashboard
This is your "Program Health" view. It provides a visual summary of how your organization is trending over time.
Focus: High-level KPIs such as Lured Rate, Report Rate, and "Time to Lure" (how quickly users fall for an attack).
Why it’s useful: It allows you to quickly identify if your overall security culture is improving or if a specific campaign had an unusual impact.
Key Data: Includes the "Lured by Emotions All Time" pie chart and 30-day trend lines.
2. Phishing Report Details
This is your "Organizational Context" view. It moves away from charts and into structured tables categorized by your company’s hierarchy.
Focus: Breaking down outcomes by User, Manager, Department, and Simulation.
Why it’s useful: It answers where the risk is located. You can identify if a specific department needs more training or if a particular manager's team is consistently underperforming.
Key Data: Detailed tables showing "Phishing Attacks Sent" vs. "Submitted Sensitive Information" for every segment of your business.
3. Emotional Susceptibility Profile (ESP)
This is your "Behavioral Science" view. It analyzes the psychological triggers behind a user's actions.
Focus: Identifying which emotions—such as Curiosity, Fear, Greed, or Urgency—most frequently lure your users into interacting with a phish.
Why it’s useful: It allows you to move beyond "who clicked" to "why they clicked." This helps you customize future training to address specific psychological vulnerabilities.
Key Data: The "Phishing Susceptibility Bucketing" chart, which classifies users into High or Low Risk based on their emotional triggers.
4. Phishing Audit Log
This is your "Forensic Evidence" view. It acts as a chronological ledger of every single event in a phishing attack.
Focus: Technical and event-level data, including IP addresses, device types (Mobile vs. PC), OS, and exact event timestamps.
Why it’s useful: If a user disputes an action or if you need to perform a deep-dive security audit, this log provides the "receipts" for every interaction.
Key Data: The journey of a single "Attack ID," showing the path from "Email Sent" to "Link Clicked" to "Form Interaction".
FAQ
General Platform Information
How often is the data on my dashboard updated? The dashboard is not real-time; it refreshes approximately every 60 minutes.
What is the "Time to Lure" metric? This metric calculates the average time, in hours, that it took for users to be lured by a phishing attack after it was sent.
Why do some "Time to Report" values appear blank? A blank value usually indicates that no reports were captured for that specific time period or simulation.
Can I see data from simulations I have deleted? By default, history from deleted simulations is hidden to keep your dashboard clean. However, you can toggle this on if you need to perform a historical audit.
Scheduling & Exports
Can I automate my reports to be sent to my email? Yes. You can use the "Scheduled Exports" feature to have professional-grade reports delivered to stakeholders automatically on a recurring basis.
What file format should I use for exports? While PDF and PNG are available, we strongly recommend exporting in Excel (.xlsx) or CSV. PDF files may cut off data rows if the report contains a large amount of information.
Who sends the automated report emails? Scheduled emails are sent from a generic system domain:
info@send.sigmacomputing.com.Is it possible to customize the branding or sending domain of these reports? At this time, custom client logos and custom sending domains for scheduled reports are not supported.
Investigations & The Audit Log
What is the difference between the Phishing Dashboard and the Phishing Audit Log? The Dashboard provides high-level KPIs and trends. The Audit Log is a "specialist mode" that provides granular, event-by-event details for every attack, including device types, IP addresses, and exact timestamps.
How do I track "Repeat Clickers"? A dedicated section at the bottom of the Phishing Audit Log highlights individuals who interacted with the same attack multiple times, helping you prioritize coaching for high-risk users.
Does the Audit Log replace the old Results CSV? Yes. The Audit Log provides the same level of granular detail as the legacy Results CSV but within a searchable, filterable interface that includes full organizational context.
If I apply a filter on one tab, does it carry over to the Audit Log? No. Filters on the Phishing Audit Log are independent; they do not carry over to other tabs, and filters from other tabs do not apply to the Audit Log.
Comments
0 comments
Please sign in to leave a comment.