The Phish and Training dashboard module allows the admin to see various statistics and reports on the platform.
Here is where you can see real-time results for your awareness training campaigns, phishing campaigns, and user performance.
Phish Reports
1. Click on Reporting & Insights and select “Phishing Reports” from the submenu options.

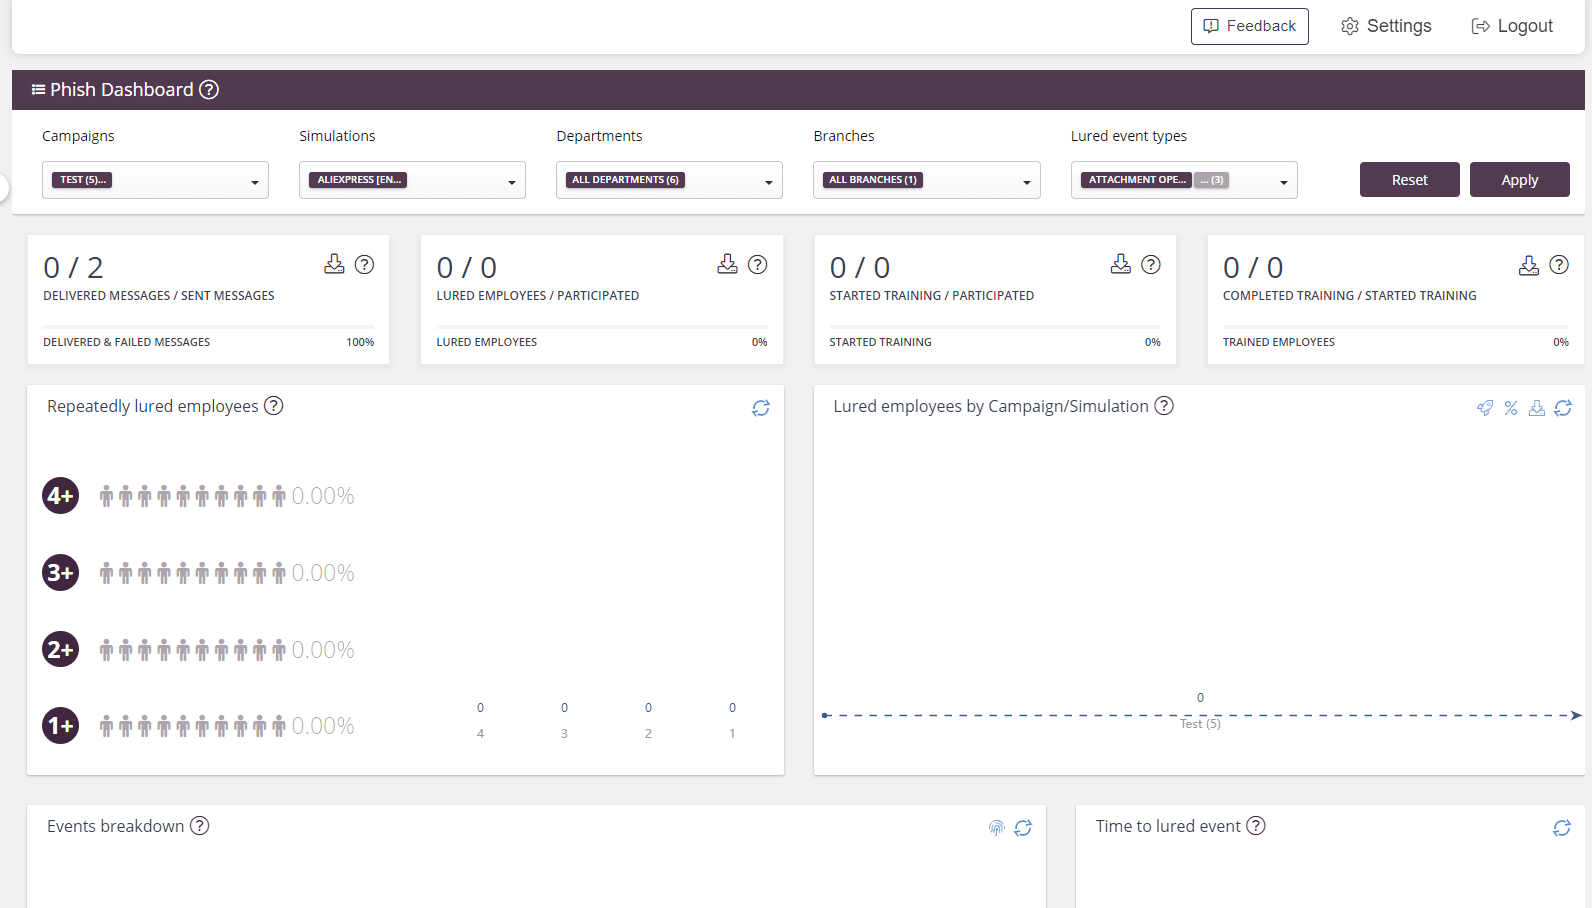
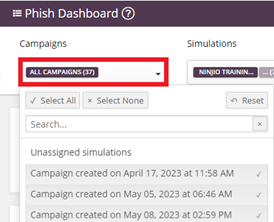
2. Once you are on the Phish Dashboard page, you will see that your results may appear to be blank by default. This happens because no campaigns have been launched yet. If a campaign has been launched, the results for the most recent campaign will default to the Phish Dashboard. To filter results, select the campaigns/simulations drop-down lists and filter out “Unassigned simulations” to include simulations NOT part of a smart campaign. After this, hit the “Apply” button in the right-hand corner.
(Note** Clicking the reset button will clear your results.)
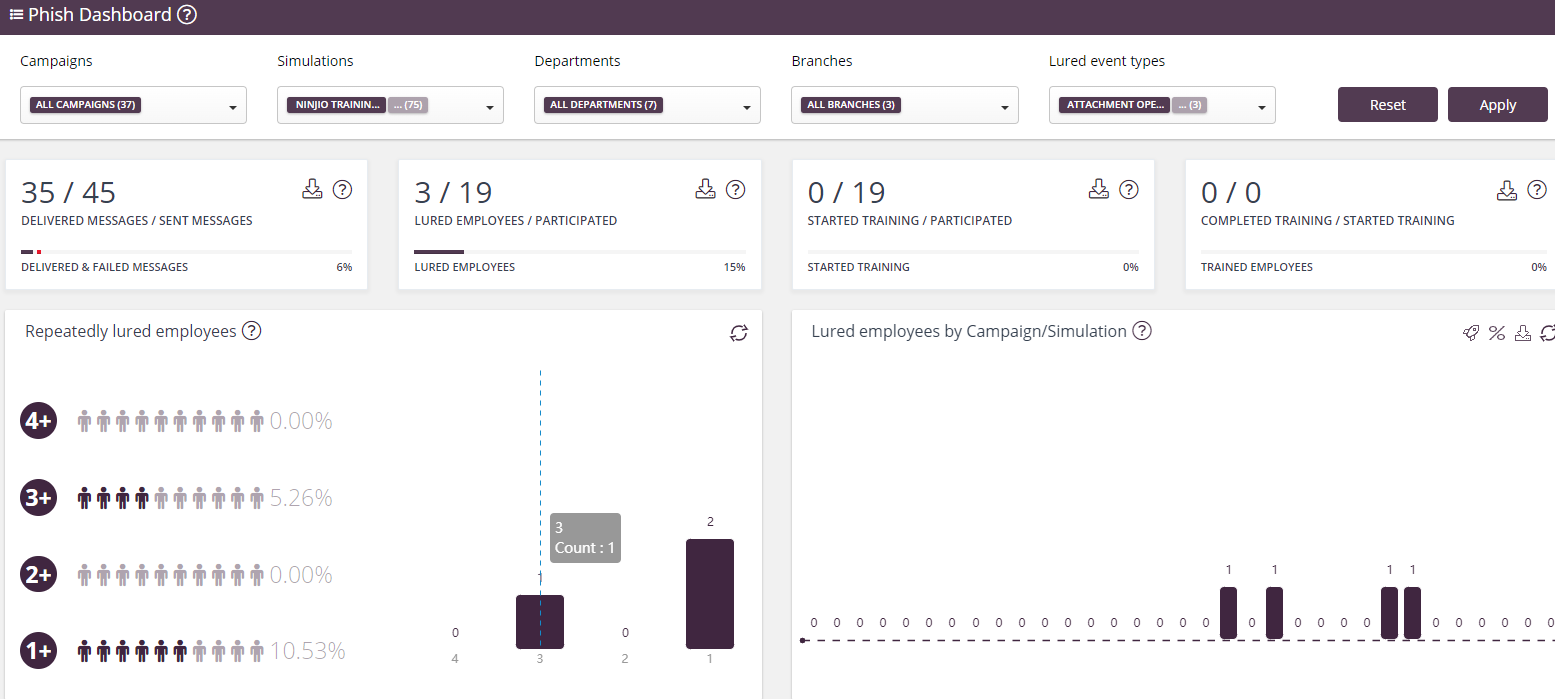
3. The Phish Dashboard has specific datasets options on lured offenders, remedial training, and email deliverability.
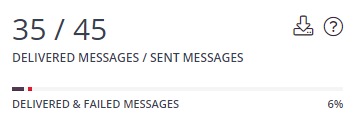
-Delivered Messages/Sent Messages- This shows the number of users who had their emails successfully delivered to them.
The New Platform can track which email addresses provide a bounce back.
![]()
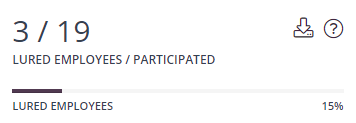
-Lured Employees/Participated- This is the total number of users who failed a simulated phish campaign. Clicking the “Lured event types” dropdown list lets you specify what constitutes failure.
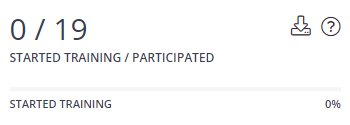
-Started Training/Participated- This is the total number of participants that started the training/reached a static teachable moments page.
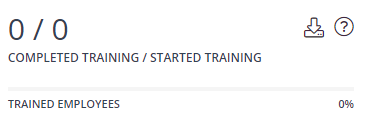
-Completed Training/Started Training- This is the total number of participants who completed a training video.
(Note** Some Dashboard Graphs and Datasets have data metrics that can be downloaded in a csv format by clicking the “Download” icon.)
If you'd like to view a step-by-step demo, click here!
Training Reports
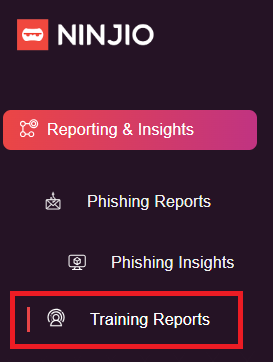
1. Click on Reporting & Insights and select “Training Reports” from the submenu options.
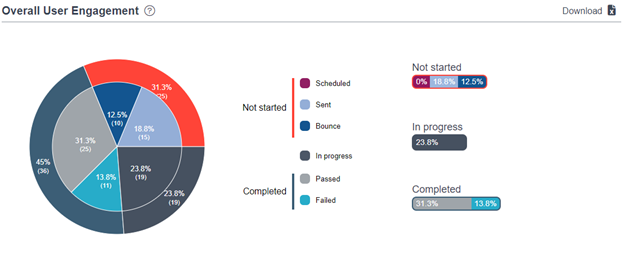
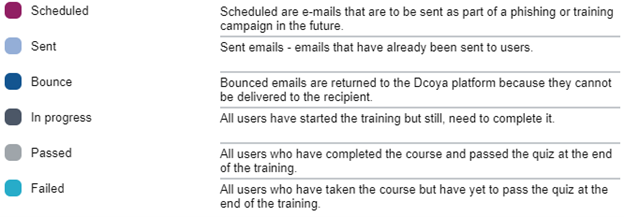
2. Once the dashboard populates, you will be greeted by the Overall User Engagement Pie chart, Leaderboard, User Performance, and Training Engagement metrics. The Overall User Engagement will highlight enrollment and completion events data. This is broken down by enrollment status and if they have passed or failed the training. You will also see sending status pending status based on email deliverability and interaction.
3. Leaderboard will provide information on who your top performers in the organization are.

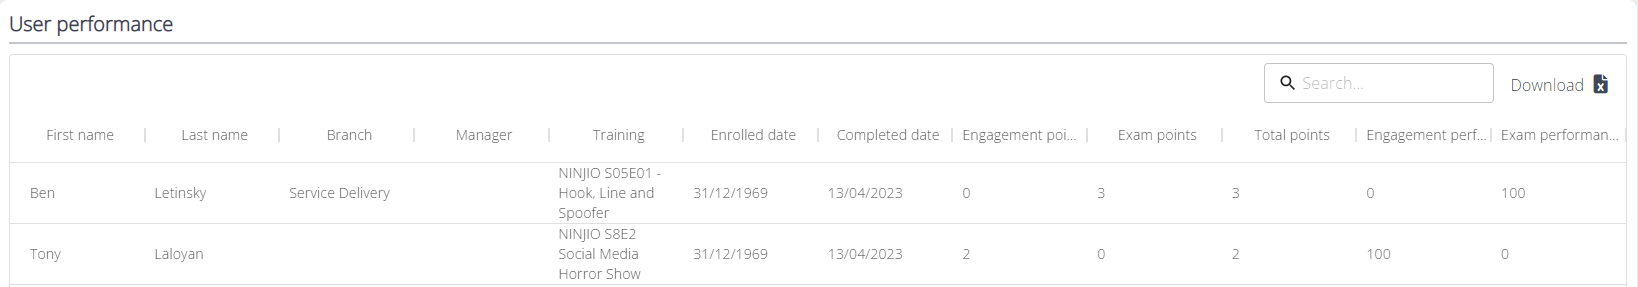
4. User performance will give an individual breakdown of each enrollment per user, including their completion status for engagement and exam performance.
5. Training Engagement will display the training launched so far with overall metrics of enrollments, completion, engagement, and exam performance.

(Note**All three data sets can be downloaded into a csv format on the upper right-hand corner.)
Comments
0 comments
Please sign in to leave a comment.